


 KlipFolio, a provider of desktop notification widgets for almost a decade has opened a limited beta and early experience program for its new Klipfolio Dashboard, a business intelligence solution that works on desktops, laptops, netbooks, smart phones, and tablets.
You can request a beta key to get started although I’m not aware how many requests are being filled at this time.
I put this product in the “lightweight” class of BI tools for two reasons –
- It’s a SaaS architecture; they host everything.
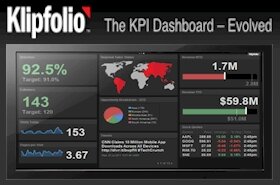
- It’s a KPI solution; it provides unified displays of distilled performance indicators.
But “lightweight” is just a label. You can build all sorts of useful BI-like reports and data visualizations that emerge from deep integration of business data. I also place Geckoboard in this class (see iPad BI Dashboards for Small Businesses, GeckoBoard Delivers). Given what I’ve seen in the beta, Klipfolio is much like Geckoboard and each company has created uniqueaspects to meet customer requirements.
Klipfolio is certainly lightweight in its implementation approach. In just a few minutes you are off to a flying start and pulling in data and organizing a presentable dashboard that will impress the heck out of most business leaders. There’s nothing to install and the dashboards seems to work very well on iPad and all iOS devices with clarity and good rendering performance.
Like many SaaS companies, the folks at Klipfolio have set aside the development of a native iOS app and instead focused on leveraging the web to deliver cross-platform support from the largest displays down to the smallest mobile device screens. I think this is a smart choice – BI is typically a consumption-centric solution and delivering data efficiently, regardless of the display type, is a core competency. The folks at RoamBI might disagree, but I predict they will be pressured into supporting Android and other portable des soon.
In comparison to products such as RoamBI and Microstrategy’s Mobile suite, which typically access and visualize very deep enterprise data relationships, Klipfolio is more about narrowing your data to provide workers with performance indicators that are real-time and easily understood.

Integration Tools
In most BI solutions, an integration expert is required to liberate your data. They use scripting services to build interfaces that can expose the most important data to be used as key performance indicators (KPIs). In most cases, this requires the development of RESTFUL web services or custom XML feeds that the BI rendering engine requires. RoamBI takes a little different approach. For lightweight solutions, you can upload an Excel spreadsheet and map the data directly to the visualization requirements. This is cool, but not ideal in every case.
I was pleasantly impressed with Klipfolio’s approach which is fundamentally unique. Every component in the dashboard contains its own configurable integration solution. Sometimes the data comes from an XML file. In some cases the data might come from a spreadsheet, or a database interface. And in some cases, it could be a static item that’s updated manually.
The interface for configuring these different integrations is unified through a set of tools that help you target the specific data elements you need for a given component.

This approach transforms the integration process to include all sorts of dashboard designer wanna-bees – business domain experts who, with a little training, can build very useful dashboards without writing large checks to IT consultants.
The integration framework in Klipfolio Dashboard also offers a lot to the highly technical integrators. In minutes I was able to leverage an XML file and walk the XPath to drill into the data I needed. It’s evident from looking at the next screen shot that the developers really understood how best to enable techies and non-techies alike, to frolic with data of any type to achieve integration requirements.


[...] it emerged from beta last year, there has been plenty to complain about, but in hindsight, almost everything I tossed on [...]